Team Members
- Jihoon Og
- Qianxi Li
Exercise 5: Machine Learning for Robotics
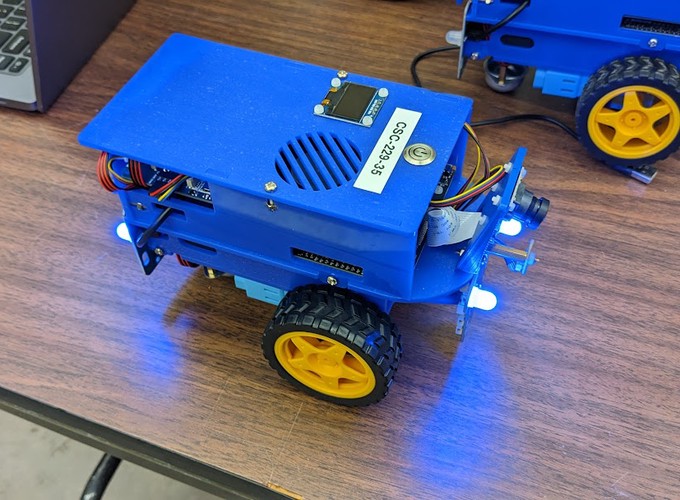
In this exercise we learned some basics of machine learning, how to train and validate a deep learning model, how layers like dropout works, how data augmentation techniques like random crop, image normalization, and random rotation work. After getting a trained model, we deployed it in a Duckiebot container to handle a single-digit number recognition task. The goal is to have the Duckiebot do lane following and exploring the Duckietown environment, and once a digit is detected from the image input, report the figure, the Apriltag it is associated with, the location of the Apriltag and memorize this detection. All nodes should stop once all 10 digits are found.
Deliverable 1
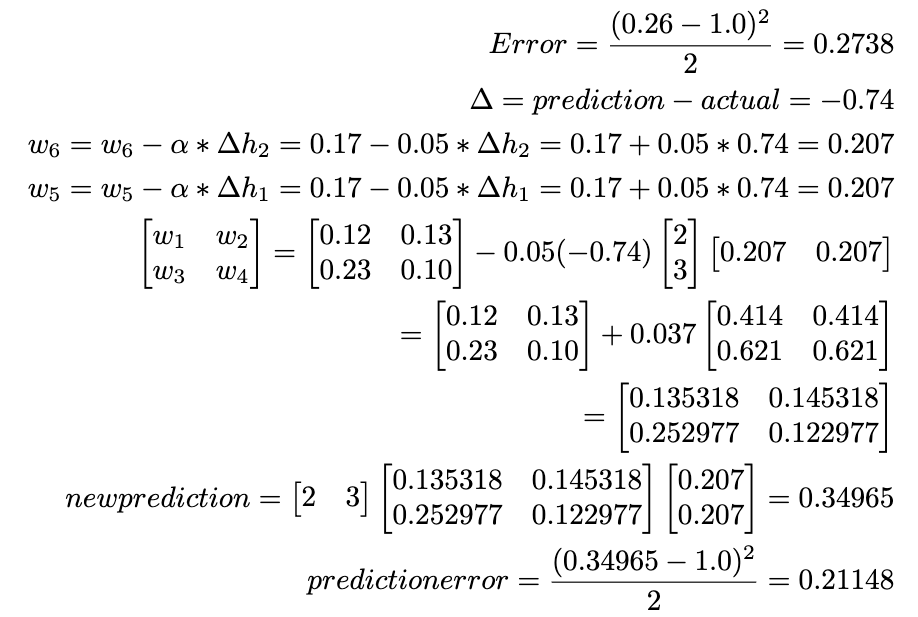
The figure below shows the result of doing one iteration of backpropagation. The forward pass lets us calculate a direct error of the predicted label compared to the actual label. Using backpropagation lets us propagate the gradient back to each layer of the computation graph so that they can update with respect to the changes correspondingly. Because the prediction error is smaller in this iteration compared to the previous iteration shows that the model is learning.
Deliverable 2 Questions and Answers
- What data augmentation is used in training? Please delete the data augmentation and rerun the code to compare.
The image has been randomly rotated between positive and negative 5 degrees, in addition a random crop is added to the training image where a 2 pixel padding is applied to the image before taking a random 28x28 square crop essentially shifting the number within the image. Finally, the data is then normalized in a PyTorch tensor. With the transformations the test accuracy was 97.91%. Without the transformation the test accuracy was 97.88%.
- What is the batch size in the code? Please change the batch size to 16 and 1024 and explain the variation in results.
The default batch size is 64. With batch size 16 the test accuracy was 97.85%, but training took much longer (twice as long) as with using a batch size of 64. With batch size 1024 the test accuracy was 97.45% and training still took a lot longer but still faster than training with a batch size of 16. The reason for the difference in training time could be caused by the overhead of transferring the mini-batches from the CPU’s memory to the GPU’s memory. A larger batch size will take longer to process but have less of them to process. While a smaller batch size will take less time but more of them to process. The overhead of transferring the images to the GPU’s memory is multiplied by the number of batches, and this overhead scales with the number of images being transferred. Therefore, there is a happy medium where the training throughput is maximum while the total overhead of data being transferred is minimized.
- What activation function is used in the hidden layer? Please replace it with the linear activation function and see how the training output differs. Show your results before and after changing the activation function in your written report.
The default activation function is ReLU or Rectified Linear Unit. Using a linear activation function caused the test accuracy to dropped to 83.53%. In contrast, using the ReLU activation function lead to a 98% accuracy for the test set.
- What is the optimization algorithm in the code? Explain the role of optimization algorithm in training process
The default optimization algorithm used is Adam. The optimization algorithm is used to update the parameters of the model with respect to the loss calculated during training.
- Add dropout in the training and explain how the dropout layer helps in training.
I added dropout layers after the 2 hidden layers after the non-linear activation function with a dropout probability of 0.1 or 10%, and it produced a test accuracy of 97.58% on the test set. Dropout is useful when your model is overfitting on the training dataset. Because dropout randomly sets some nodes to 0, it effectively creates a new model where other nodes can learn from the training data.
Deliverable 3
In this section we trained a machine learning model to learn single-digit numbers from the MNIST dataset to recognize the single-digit numbers attached to the AprilTags in the Duckietown environment.
Here is the model architecture that we used.
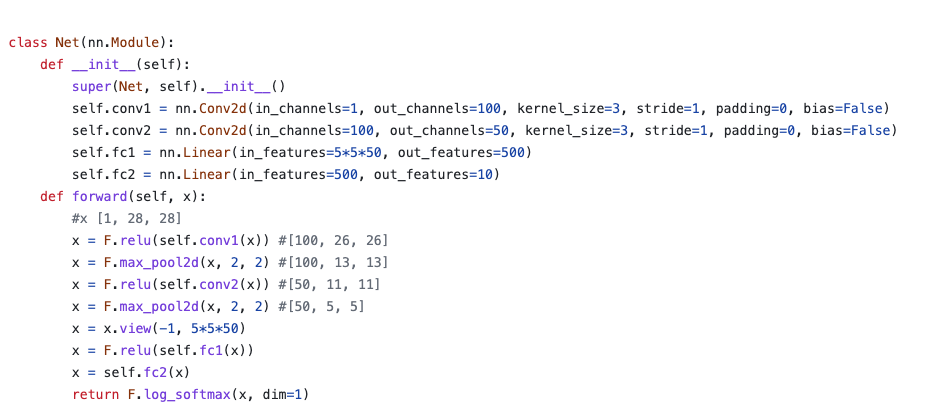
Since the convolutional neural network is specialized in processing image information, we used it to extract high-level features and use those features in a fully connected layer so that it can generate a vector of length 10. This will tell us the prediction probability for the inputted image to be one of the labels. We then can use the argmax function to get the estimated label with the highest probability.
We also used data augmentation techniques like random crop, normalization, and random rotation to make our model more robust to the input with different orientations and lighting conditions. In addition, we trained the model for 5 epochs and the final validation accuracy is around 98.2%.
There is room for improvement since 100 channels may not be necessary for our task and environment. Our next iteration if we had time would consider using dropout layers and tune the number of channels to be as if not more robust but less complex than the current model.
The video below shows our Duckiebot driving around the Duckietown environment detecting and identifying the numbers and stopping once all 10 digits have been correctly identified.
As you can see in the video, the Duckiebot starts from a random location in Duckietown, and start to do lane following automatically. It will also detect the Apriltags and the numbers with blue backgrounds. Once both are detected, the Apriltag’s location and the number detection’s result will be printed out to the terminal, the detection history will also be memorized. The bounding box of the detected number will be visible through RViz. The Duckiebot randomly makes a turn or goes straight at intersections to explore the whole Duckietown, once all 10 figures are found, all nodes terminate. Overall it finished the task, but there were some problems with the system design which we will discuss them below.
For the detection part, since we know the figures are black and the background blue, we can just use OpenCV to mask and create bounding boxes to shrink down our detection region to a small rectangle, instead of the whole image. The image is then converted to black and white, resize to 28 by 28 and feed into the CNN to make predictions. The actual prediction is the most frequent prediction for the (number, AprilTag) pair in the detection history, we did this because sometimes the detection region for a figure can be inaccurate from a relative far distance, as it moves closer, the bounding box will be more accurate, and we don’t want the detection result to be unstable.
We can see from the video that sometimes the detection cannot be done quickly. Several reasons for this:
- The duckiebot didn’t stay close enough and observe the figure long enough before it made its turn or passed the figure. Sometimes the robot drove past the AprilTag, but the figure in the image can be close to the edge of the image and undistorted.
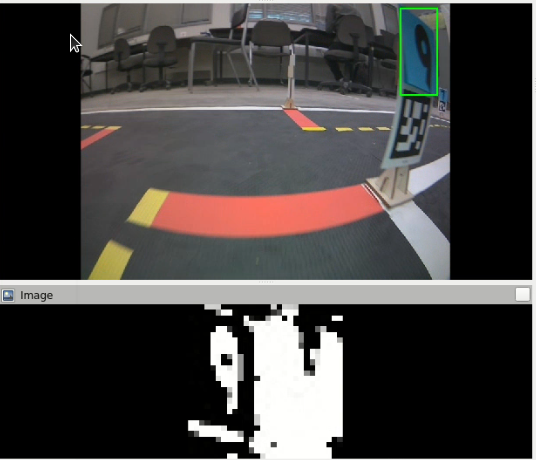
- Network delays: In the last 1-2 minutes of the video, the network started to get delayed, if the model cannot get the current video frame, then it cannot make the right prediction. (See the image below, this black and white image was fed into the model throughout the whole duration where figure 9 appeared, and the model cannot make the right prediction).
- We need a better way to prevent lane following from rushing out of the Duckietown environment. The current design can make sure the robot can move randomly left, right, or straight at the intersection but these options are not always available.
- We ran all the nodes on the laptop, but a better solution would be to run the figure detection on the laptop and the rest on the robot to improve performance.
How well did your implemented strategy work? Was it reliable? In what situations did it perform poorly?
Our implemented strategy could finish the task, it’s okay to use but not perfect and not 100% reliable. Some situations could make it perform poorly:
- Network issue (for sure), high delay in communication.
- Having someone wearing a shirt with the same blue color as the figure background has. We can give more restricts to the detection region to solve this problem, but yes, our current design cannot handle this. The bounding box detector can also be sensitive to the light condition in the room.
- Driving too fast can make it miss the target.
Repo Link
References
This is a list of references that I used to do this exercise.
- Backprop: https://hmkcode.com/ai/backpropagation-step-by-step/
- “Multilayer Perceptron.ipynb” uploaded on eClass